2. Skeleton Graphs
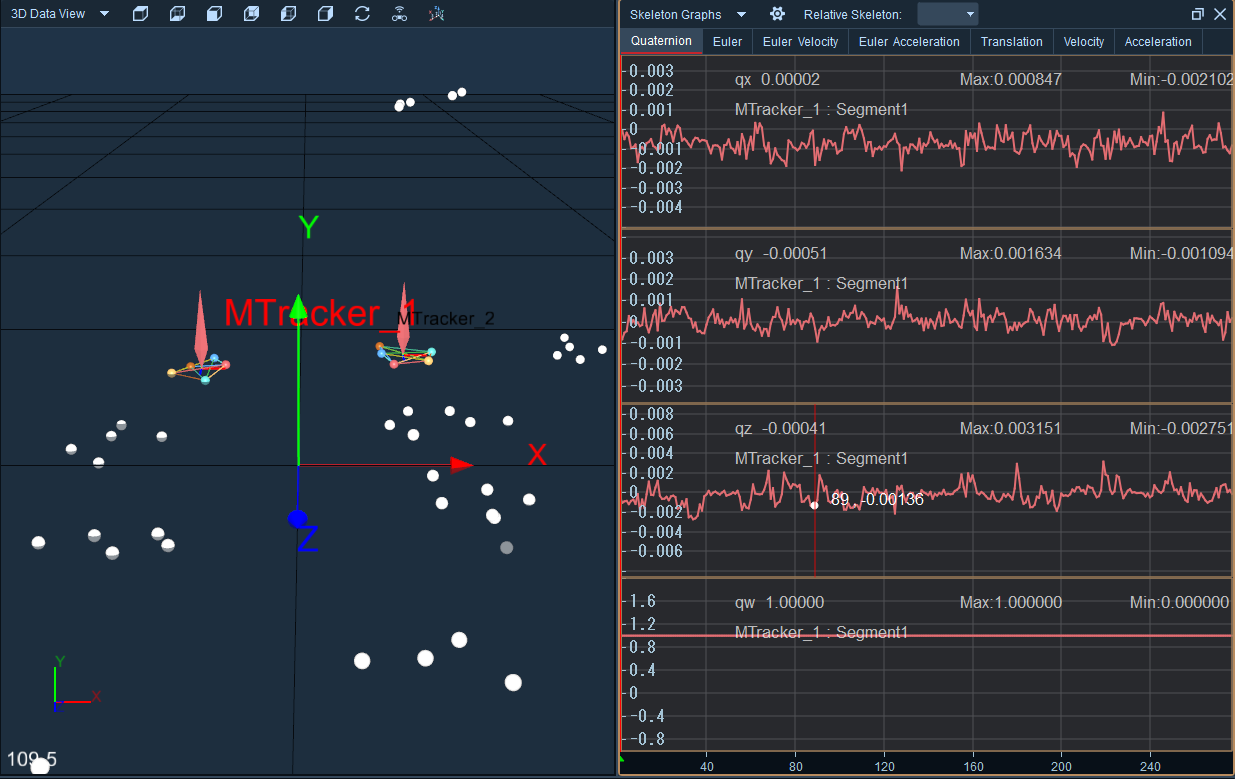
- Click the button on the upper toolbar to display the skeleton graph. Select the skeleton in the MarkerSet list in the asset panel, and its data curve will be displayed in the skeleton graph. The "qx, qy, qz, qw" values on the right represent the quaternion of the skeleton's rotation (11.2.1).
.png)
11.2.1
- In the bone chart, you can choose to view "quaternion, Euler angles, angular velocity, angular acceleration, translation, velocity, and acceleration" of bones. The "frame rate" in the bone chart setting panel can calculate the frame interval of bone data. Frames of "3, 5, 7, and 9" can be selected for calculation.
- The skeleton chart has added a lost skeleton identification display. When some frames of the loaded data have missing skeletons, a blue lost identifier will be drawn on the skeleton chart, helping us quickly locate the frames with missing skeletons.
.png)
Skeleton relative position column
- The skeleton chart has added a relative position column: In real - time mode, create two rigid - body assets, open the skeleton chart, select the skeleton of the current rigid - body asset, choose another rigid - body in the "Relative Skeleton" column, and the "quaternion, Euler angles, translation" data of the current skeleton relative to the selected rigid - body will be displayed on the skeleton chart;
- Load data of multiple rigid bodies in post - processing mode. According to the above operations, the "quaternion, Euler angles, translation" data of the current rigid - body skeleton relative to other rigid - body skeletons can also be viewed.
- Expand the "Relative Skeleton" column, click "Clear", the rigid body selected in the "Relative Skeleton" column will be cleared and restored to the default, and the skeleton data on the skeleton chart will also be reset to display the skeleton data of the current rigid body.